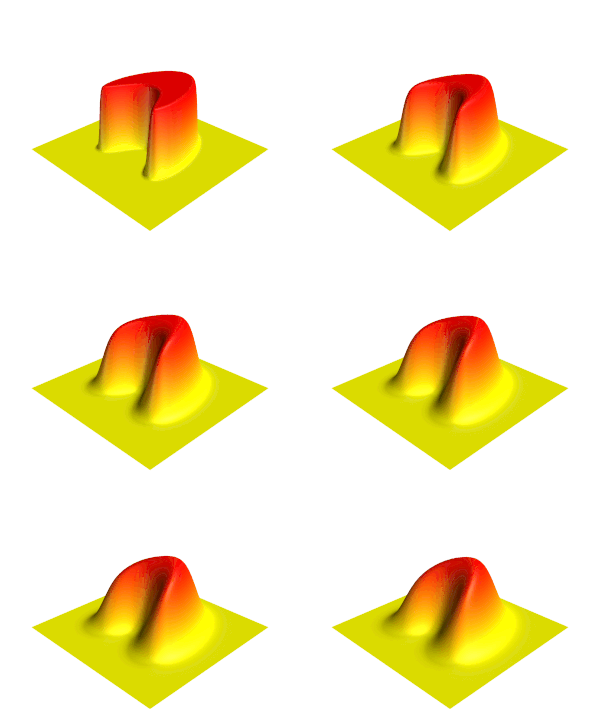
Plik:Heat eqn.gif

Treść strony nie jest dostępna w innych językach.
Ten plik jest umieszczony w Wikimedia Commons
Z Wikipedii, wolnej encyklopedii

Heat_eqn.gif(200 × 136 pikseli, rozmiar pliku: 500 KB, typ MIME: image/gif, zapętlony, 181 klatek, 6,0 s)

Opis

Opis
English: Illustration of the Heat equation.
Data (UTC)
Źródło Praca własna
 
Ten diagram został stworzony za pomocą MATLAB.
Autor Oleg Alexandrov
Inne wersje

Licencja

Public domain Ja, właściciel praw autorskich do tej pracy, udostępniam ją jako własność publiczną. Dotyczy to całego świata.
W niektórych krajach może nie być to prawnie możliwe, jeśli tak, to:
Zapewniam każdemu prawo do użycia tej pracy w dowolnym celu, bez żadnych ograniczeń, chyba że te ograniczenia są wymagane przez prawo.

MATLAB source code

% illustration of the heat equation
% Solve the heat equation using finite differences and Forward Euler
function main()
 
   % the number of data points. More points means prettier picture.
   N = 400;
 
   L = 2.5; % the box size is [-L, L] x [-L, L]
 
   XX = linspace(-L, L, N);
   YY = linspace(-L, L, N);
   [X, Y] = meshgrid(XX, YY);
 
   scale = 2;
   Z = get_step_function (N, scale, X, Y);
 
   CFL = 0.125; % CourantFriedrichsLewy
   dx = XX(2)-XX(1);  dy = dx; % space grid
   dt = CFL*dx^2;
 
   plot_dt = 0.004; % plot every plot_dt iterations

   cmap = rv_matrix_rows(autumn); % colormap
   
   % Solve the heat equation with zero boundary conditions
   T = 0:dt:1;
   iter = 0;
   frame_no = 0;
   for t=T
 
      % plot the current temperature distribution
      if floor(t/plot_dt) + 1 > frame_no
 
         frame_no = frame_no + 1
 
        % plot the surface
         figure(2); clf; 
         surf(X, Y, Z);
 
         %  make the surface beautiful
         shading interp; colormap(cmap); 
 
         % add in a source of light
         camlight (-50, 54);
         lighting phong;
 
         % viewing angle
         view(-40, 38);
 
         axis equal; axis off;
         axis([-L, L, -L, L, 0, scale])
 
         hold on; plot3(0, 0, 3.4, 'g*'); % a marker to help with cropping
 
         pause(0.1);
         %return
 
         file = sprintf('Movie_frame%d.png', 1000+frame_no);
         %saveas(gcf, file) %save the current frame
         print(gcf, '-dpng', '-r400', file) %save the current frame
 
         disp(file); %show the frame number we are at
 
         % cut at max_fr_no frames
         max_fr_no = 15; 
         if frame_no >= max_fr_no
            break
         end
 
      end
 
      % advance in time
      W = 0*Z;
      for i=2:(N-1)
         for j=2:(N-1)
 
            W(i, j) = Z(i, j) + dt * ( Z(i+1, j) + Z(i-1, j) + Z(i, j-1) + Z(i, j+1) - 4*Z(i, j))/dx^2;
 
         end
      end
      Z = W;
 
   end
 
 
% The gif image was creating with the command 
% convert -antialias -loop 10000  -delay 20 -compress LZW Movie_frame10* Heat_eqn.gif 
 
% get a function which is 1 on a set, and 0 outside of it
function Z = get_step_function(N, scale, X, Y)
 
   c = 2;
   d=-1;
   e=1;
   f=0.5;
   k=1.2;
   shift=10;
 
   Z = (c^2-(X/e-d).^2-(Y/f).^2).^2 + k*(c+d-X/e).^3-shift;
 
   Z = 1-max(sign(Z), 0);
   Z = scale*Z;

function X = rv_matrix_rows(X)

   [m, n] = size(XL);

   for i = 1:m
      j = m + 1 - i;
      if i < j
         tmp = X(i, :); X(i, :) = X(j, :); X(j, :) = tmp;
      end
   end

Podpisy

Dodaj jednolinijkowe objaśnienie tego, co ten plik pokazuje

Obiekty przedstawione na tym zdjęciu

przedstawia

image/gif

Historia pliku

Kliknij na datę/czas, aby zobaczyć, jak plik wyglądał w tym czasie.

Data i czasMiniaturaWymiaryUżytkownikOpis
aktualny20:01, 2 lut 2024Miniatura wersji z 20:01, 2 lut 2024200 × 136 (500 KB)Jahobrmore frames (by user Emil Dalalyan)
03:25, 12 kwi 2019Miniatura wersji z 03:25, 12 kwi 2019200 × 136 (172 KB)Jorge StolfiDuplicated some framed at beginning so that readers can see the initial state. Added a couple blank frames at end to make it clear that the simulation ended. Slowed down the movie a bit.
21:58, 24 kwi 2011Miniatura wersji z 21:58, 24 kwi 2011200 × 136 (116 KB)Oleg AlexandrovReverse the colormap (red is high).
08:11, 23 lis 2007Miniatura wersji z 08:11, 23 lis 2007199 × 140 (126 KB)Oleg AlexandrovTweak, same license
07:51, 23 lis 2007Miniatura wersji z 07:51, 23 lis 2007200 × 129 (112 KB)Oleg Alexandrov{{Information |Description=Illustration of the en:Heat equation |Source=self-made with Matlab |Date=~~~~~ |Author= Oleg Alexandrov |Permission=PD-self, see below |other_versions= }} {{PD-self}} ==MATLAB source code== <pre>

Poniższa strona korzysta z tego pliku:

Globalne wykorzystanie pliku

Ten plik jest wykorzystywany także w innych projektach wiki: