
Plik:De Finetti diagram.svg

Rozmiar pierwotny (Plik SVG, nominalnie 500 × 500 pikseli, rozmiar pliku: 14 KB)
| Plik De Finetti diagram.svg znajduje się w Wikimedia Commons – repozytorium wolnych zasobów. Dane z jego strony opisu znajdują się poniżej. |
Opis
| Opis |
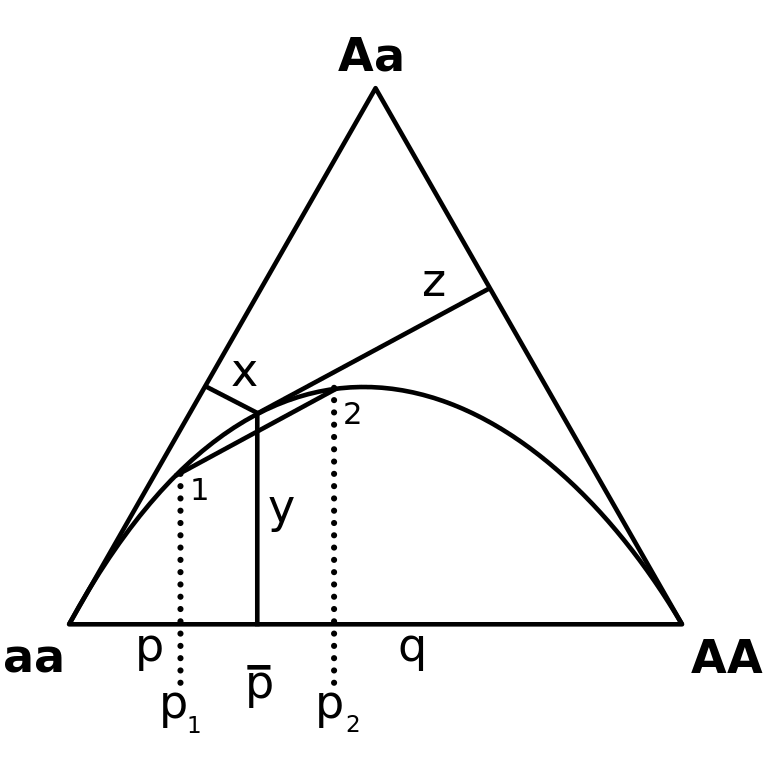
A De Finetti diagram illustrating the Wahlund effect. Genotype frequencies are given by the edge distances x (for AA), y (Aa) and z (aa). Allele frequencies p and q = 1 - p are determined by the horizontal displacement along the bottom edge connecting aa and AA, scaled by constant factor (1/2)sqrt(3) (the ratio between the height and the base of an equilateral triangle). Also p = x + y/2 and q = y/2 + z. The curved line are the Hardy–Weinberg equilibrium genotype frequencies; points 1 and 2 denote two populations in equilibrium. The genotype frequencies of the combined population are a weighted mean of the subpopulation frequencies, corresponding to a point somewhere on the solid line connecting 1 and 2. This point always has a lower heterozygosity (y value) than the corresponding (in allele frequency p) Hardy-Weinberg equilibrium. |
| Źródło | File:De finetti diagram.png |
| Autor |
SVG: Beao 02:40, 14 November 2009 (UTC) Original raster: אמר Steve Caruso (poll) 23:56, 24 June 2006 (UTC) |
Licencja
- Wolno:
- dzielić się – kopiować, rozpowszechniać, odtwarzać i wykonywać utwór
- modyfikować – tworzyć utwory zależne
- Na następujących warunkach:
- uznanie autorstwa – musisz określić autorstwo utworu, podać link do licencji, a także wskazać czy utwór został zmieniony. Możesz to zrobić w każdy rozsądny sposób, o ile nie będzie to sugerować, że licencjodawca popiera Ciebie lub Twoje użycie utworu.
- na tych samych warunkach – Jeśli zmienia się lub przekształca niniejszy utwór, lub tworzy inny na jego podstawie, można rozpowszechniać powstały w ten sposób nowy utwór tylko na podstawie tej samej lub podobnej licencji.
Historia pliku
Kliknij na datę/czas, aby zobaczyć, jak plik wyglądał w tym czasie.
| Data i czas | Miniatura | Wymiary | Użytkownik | Opis | |
|---|---|---|---|---|---|
| aktualny | 04:44, 14 lis 2009 | | 500 × 500 (14 KB) | Beao | White background and 1:s. |
| 04:40, 14 lis 2009 |  | 500 × 500 (20 KB) | Beao | {{Information |Description=De Finetti diagram. |Source=File:De finetti diagram.png |Date= |Author=SVG:~~~~ Original raster:<small>אמר</small> <tt><b><font color="#0033CC">Steve Caruso</font></b></tt> |
Lokalne wykorzystanie pliku
Poniższa strona korzysta z tego pliku:
Globalne wykorzystanie pliku
Ten plik jest wykorzystywany także w innych projektach wiki:
- Wykorzystanie na en.wikipedia.org
- Wykorzystanie na fr.wikipedia.org
- Wykorzystanie na pt.wikipedia.org