
Plik:Total US Federal Debt by President (1940 to 2015).png
Rozmiar pierwotny (916 × 589 pikseli, rozmiar pliku: 26 KB, typ MIME: image/png)
| Plik Total US Federal Debt by President (1940 to 2015).png znajduje się w Wikimedia Commons – repozytorium wolnych zasobów. Dane z jego strony opisu znajdują się poniżej. |
Opis
| Opis |
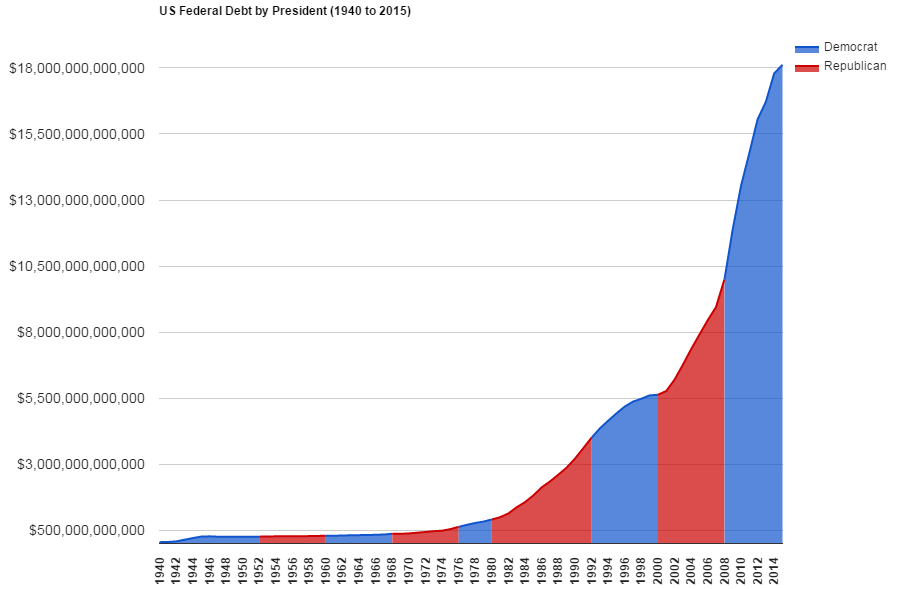
English: A chart, created using Google Spreadsheets, depicting the total U.S. federal debt from 1940 to 2014. Presidential terms of Democratic (blue) and Republican (red) presidents are shown.
|
| Data | |
| Źródło | Praca własna |
| Autor | SColombo based on style & updated datasource of previous version by Ninjatacoshell. White House recently released final (non-projected) data through 2014 & projections through 2020. |
| Inne wersje |
|
.png)
.png)
.png)
.png)
Licencja
- Wolno:
- dzielić się – kopiować, rozpowszechniać, odtwarzać i wykonywać utwór
- modyfikować – tworzyć utwory zależne
- Na następujących warunkach:
- uznanie autorstwa – musisz określić autorstwo utworu, podać link do licencji, a także wskazać czy utwór został zmieniony. Możesz to zrobić w każdy rozsądny sposób, o ile nie będzie to sugerować, że licencjodawca popiera Ciebie lub Twoje użycie utworu.
- na tych samych warunkach – Jeśli zmienia się lub przekształca niniejszy utwór, lub tworzy inny na jego podstawie, można rozpowszechniać powstały w ten sposób nowy utwór tylko na podstawie tej samej lub podobnej licencji.

|
Udziela się zgody na kopiowanie, rozpowszechnianie oraz modyfikowanie tego dokumentu zgodnie z warunkami GNU Licencji Wolnej Dokumentacji, w wersji 1.2 lub nowszej opublikowanej przez Free Software Foundation; bez niezmiennych sekcji, bez treści umieszczonych na frontowej lub tylnej stronie okładki. Kopia licencji załączona jest w sekcji zatytułowanej GNU Licencja Wolnej Dokumentacji. |
Historia pliku
Kliknij na datę/czas, aby zobaczyć, jak plik wyglądał w tym czasie.
| Data i czas | Miniatura | Wymiary | Użytkownik | Opis | |
|---|---|---|---|---|---|
| aktualny | 23:39, 26 lut 2016 | | 916 × 589 (26 KB) | SColombo | Removed the whitespace that I'd inadvertently added in the last revision. |
| 23:35, 26 lut 2016 |  | 916 × 589 (26 KB) | SColombo | Updated to include the finalized 2015 data. Will try to rename image soon. | |
| 17:26, 12 lut 2015 |  | 916 × 589 (24 KB) | SColombo Commons | Updated to include final (non-projected) 2014 numbers which were recently released by the White House. | |
| 01:32, 13 mar 2014 |  | 955 × 574 (21 KB) | SColombo Commons | Updated to current data. As of this week, data is now available through 2013 from the White House Office of Management and Budget http://www.whitehouse.gov/omb/budget/Historicals/ so the chart is now updated through 2013. The dataset includes projecte... | |
| 01:32, 13 mar 2014 |  | 955 × 574 (21 KB) | SColombo Commons | Updated to current data. As of this week, data is now available through 2013 from the White House Office of Management and Budget http://www.whitehouse.gov/omb/budget/Historicals/ so the chart is now updated through 2013. The dataset includes projecte... | |
| 01:32, 13 mar 2014 |  | 955 × 574 (21 KB) | SColombo Commons | Updated to current data. As of this week, data is now available through 2013 from the White House Office of Management and Budget http://www.whitehouse.gov/omb/budget/Historicals/ so the chart is now updated through 2013. The dataset includes projecte... | |
| 01:32, 13 mar 2014 |  | 955 × 574 (21 KB) | SColombo Commons | Updated to current data. As of this week, data is now available through 2013 from the White House Office of Management and Budget http://www.whitehouse.gov/omb/budget/Historicals/ so the chart is now updated through 2013. The dataset includes projecte... | |
| 19:22, 5 paź 2010 |  | 1310 × 951 (41 KB) | Ninjatacoshell | {{Information |Description={{en|1=A graph, created using Microsoft Excel, depicting the U.S. federal debt from 1940 to 2009, as a percentage of gross domestic product (GDP). Presidential terms of Democratic (blue) and Republican (red) presidents are shown |
Lokalne wykorzystanie pliku
Poniższa strona korzysta z tego pliku:
Globalne wykorzystanie pliku
Ten plik jest wykorzystywany także w innych projektach wiki:
- Wykorzystanie na cs.wikipedia.org
- Wykorzystanie na de.wikipedia.org
- Wykorzystanie na es.wikipedia.org
- Wykorzystanie na fr.wikipedia.org
- Wykorzystanie na sv.wikipedia.org
- Wykorzystanie na vi.wikipedia.org
.png)