
Plik:Iceage time-slice hg.png
Rozmiar pierwotny (3208 × 2074 pikseli, rozmiar pliku: 150 KB, typ MIME: image/png)
| Plik Iceage time-slice hg.png znajduje się w Wikimedia Commons – repozytorium wolnych zasobów. Dane z jego strony opisu znajdują się poniżej. |
| Opis |
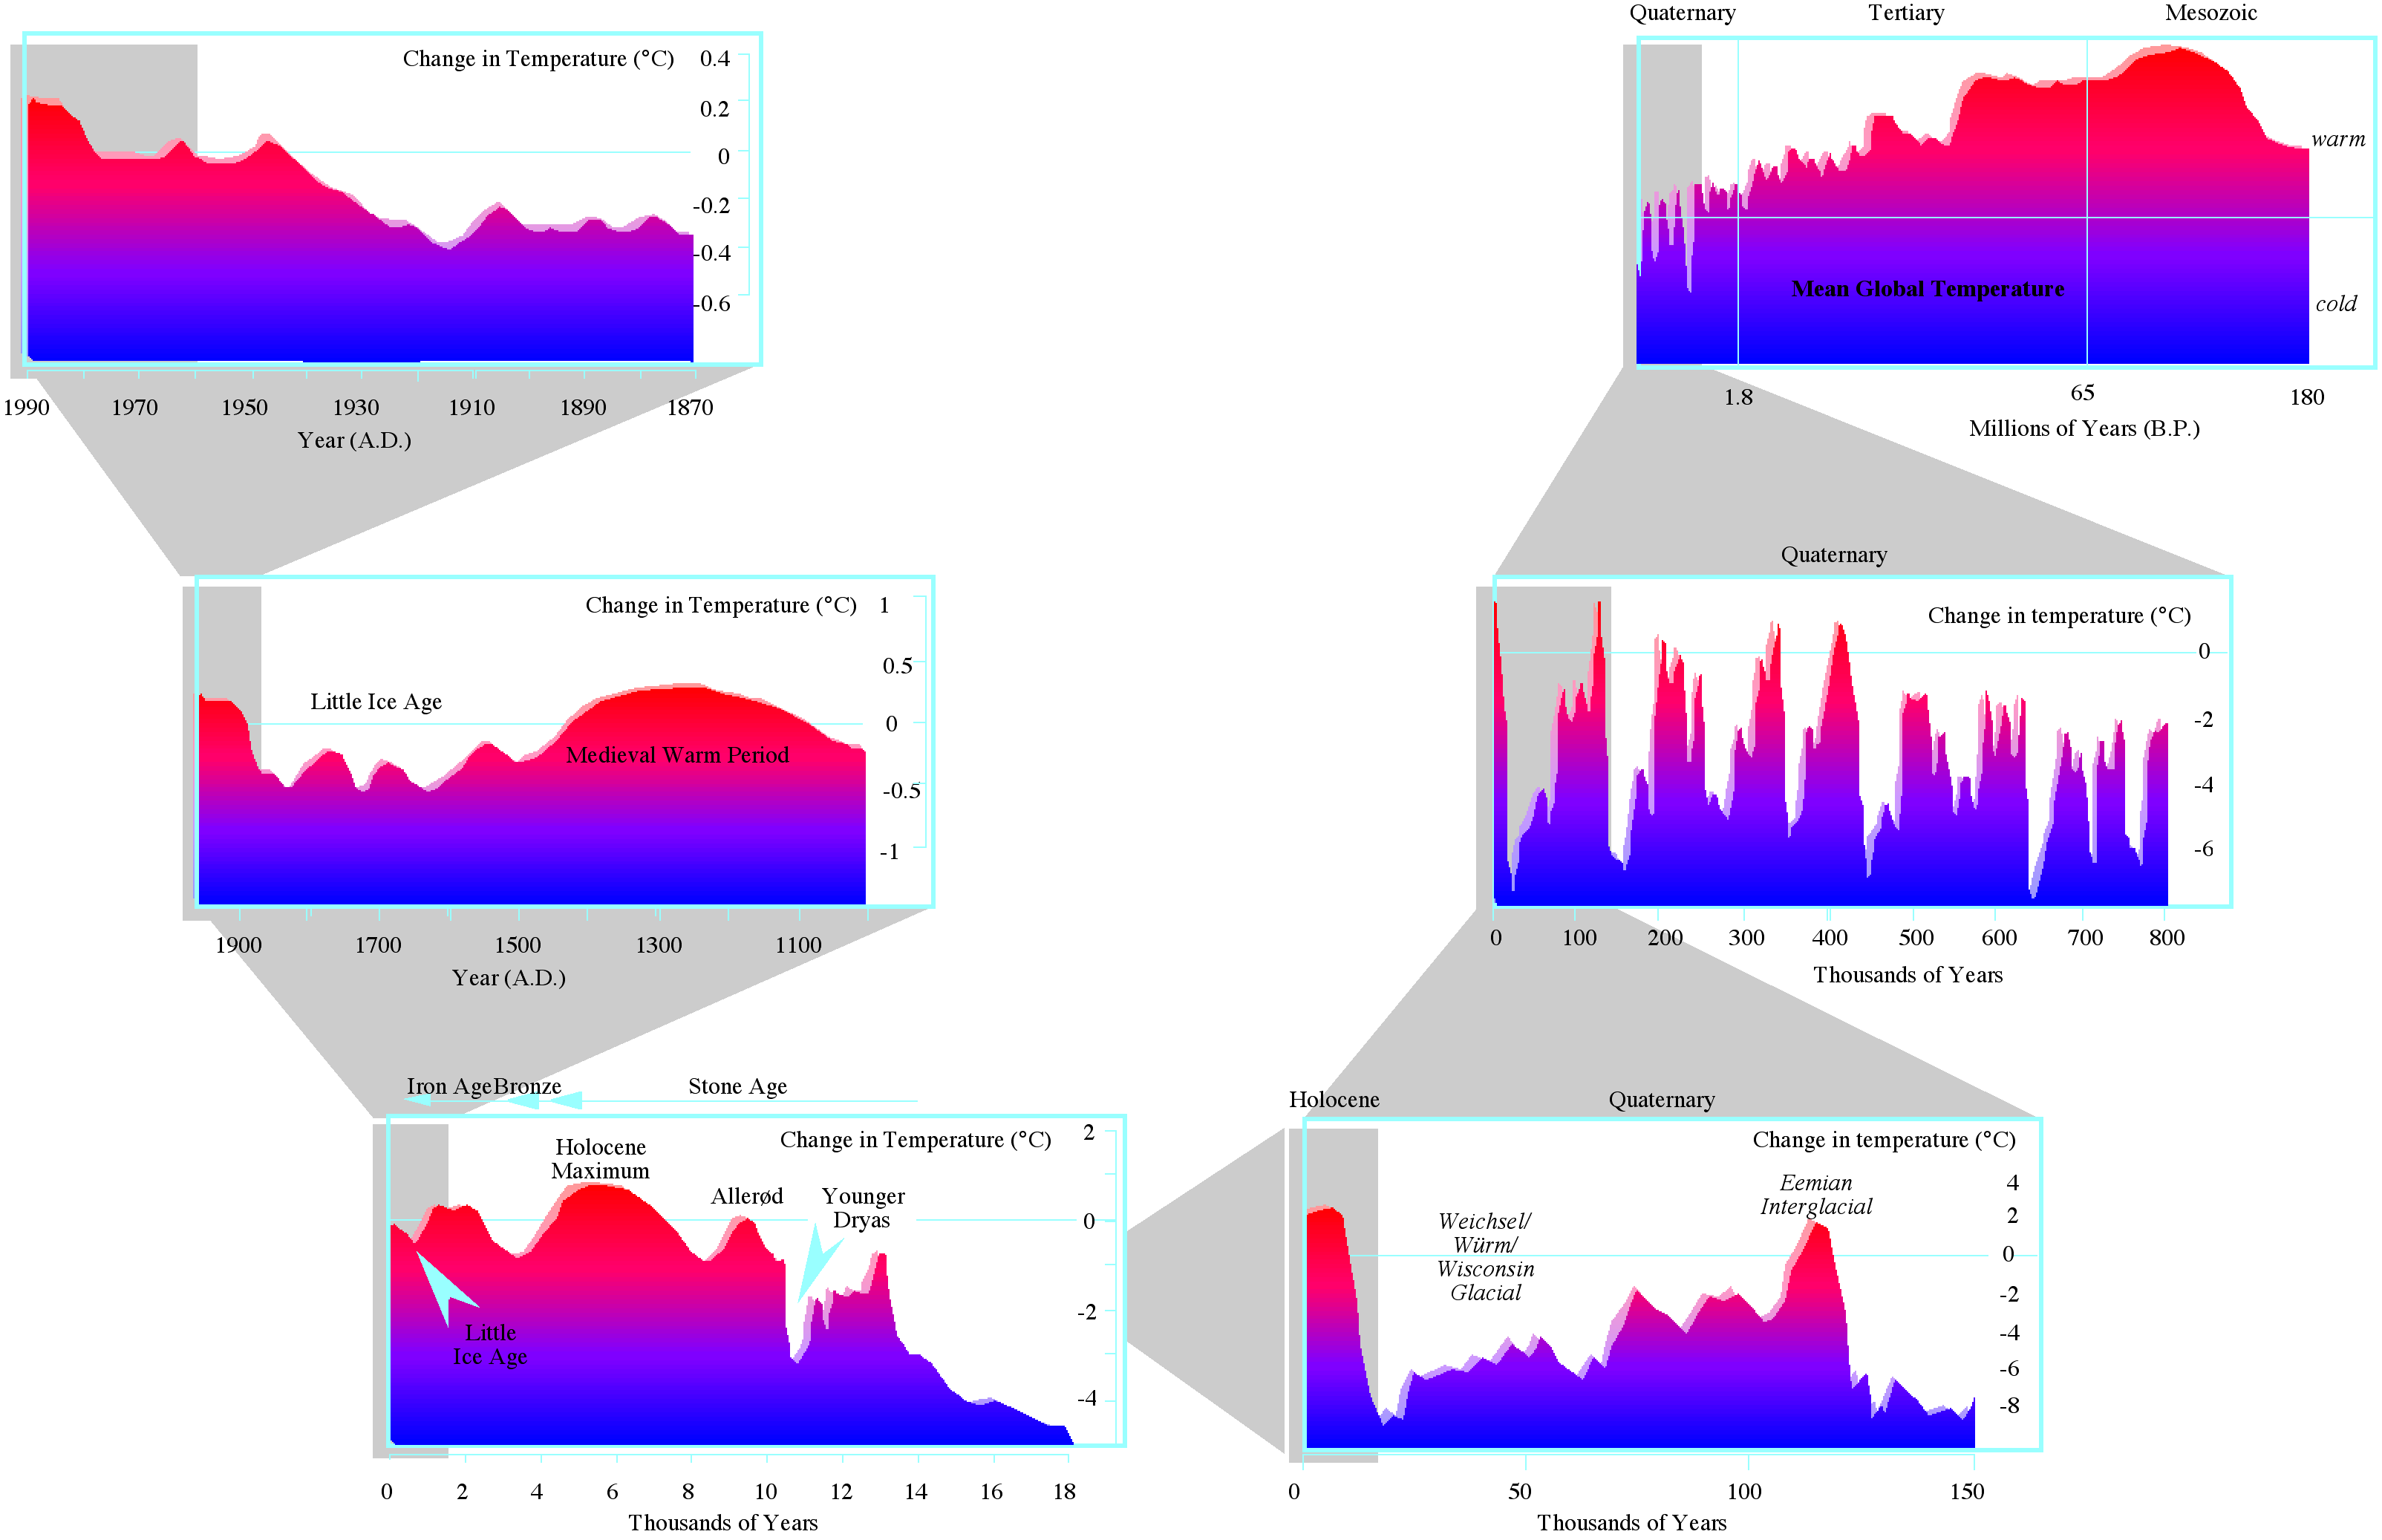
The prelude, initiation and progression of the current ice age is shown in six different time slices of temperature change (180 Mio yr, 800 kyr, 150 kyr, 18 kyr, 1 kyr, 120 yr). The grey shaded box is the extracted time slice given in the following graf in a higher resolution. Start reading from upper right to upper left:
Please keep in mind: All grafs are principle scetches and do NOT reflect the most recent knowledge of climate change in detail! Detailed original description: (1) Mean global temperature through the last 180 million years, derived from oxygen isotope analyses of various marine and terrestrial deposits (from L.A. Frakes, Climates Through Geologic Time, Elsevier, Amsterdam, 1979). The present (ca. 1900) condition, for reference, is shown as a horizontal line. Of note are (1) a global cooling trend since the time of the Cretaceous, when global surface temperatures were 8-10°C warmer than today, and (2) the onset of a continuing series of deeper, periodic glacial/interglacial oscillations in the latest, Quaternary period. Also shown (dark band) is the range of modeled surface temperature based on a doubling of atmospheric CO2, projecting an increase from present values of about 2-5°C (Crowley, 1990 doi:10.1175/1520-0442(1990)003<1282:ATASGA>2.0.CO;2). Note that a different linear time scale is used for each of the three geologic divisions. (2) Surface temperature through the last 850,000 years, derived from measurements of the ratio of 16O to 18O in fossil plankton which had settled to the sea floor and were recovered in a deepsea core from the equatorial Pacific Ocean (Shackleton and Opdyke, 1973 doi:10.1016/0033-5894(73)90052-5). The changes mainly reflect variations in global ice volume; the scale used here was added to show schematically the probable associated changes in global average surface temperature, based on a model-derived difference of 4-6°C between full glacial and full interglacial conditions (Clark, Carbon Dioxide Review, Oxford University Press, New York, 1982). The reference line at 15°C corresponds to surface temperatures of the modern era. The glacial/interglacial oscillations, characteristic of the Pleistocene epoch, are now thought to be induced by periodic variations in the orbit of the earth and in its axis of inclination (the Milankovitch effect), which act together to bring about systematic changes in the seasonal distribution of sunlight over the surface of the planet. (3) Air temperature over Antarctica, expressed as a difference from the modern surface temperature value. These estimates are derived from hydrogen/deuterium ratios measured in an ice core from the Vostok station in Antarctica (Jouzel et aI., 1987 doi:10.1038/329403a0). Of note are the present (Holocene) and the preceding, somewhat warmer "Eemian" interglacial periods, each characterized by a rapid onset to an early interglacial maximum temperature,and a subsequent, slower decline. The glacial period between, called the Wisconsin glaciation in the Americas, is itself characterized by significant variations in temperature that fall systematically to a coldest extreme (maximum glaciation) about 20,000 years before the present (B.P.). (4) Variations in surface temperature, estimated from a variety of sources, principally isotope ratios from Greenland ice cores, for the last 18,000 years. The onset and subsequent character of the present interglacial or Holocene epoch are depicted. Of note are century-scale oscillations in temperature, identified in the Greenland record and in certain European lakes, during the period of deglaciation between about 15,000 and 10,000 years B.P., and a broad Holocene maximum about 5000-6000 years B.P., when summer temperatures may have been 1-2°C warmer than the present era. At these expanded scales, the temperature excursions depicted in this and the subsequent graph are the most conjectural of the set (modified from J.T. Houghton et aI., Climate Change: The IPCC Assessment, Cambridge University Press, Cambridge, 1990). (5) Variations in surface air temperature estimated from a variety of sources, including temperature-sensitive tree growth indices and written records and accounts of various kinds, largely from western Europe and eastern North America. Of note is a possible protracted global warming through the Medieval period, when surface temperatures may have averaged about 0.3°C warmer than the A.D. 1900 reference. It was followed by a longer period of much colder conditions, loosely termed the Little Ice Age, when the estimated global mean temperature may have fallen about 0.6°C below the reference norm, reflecting global temperatures almost 1°C lower than the values attained during the middle of the current century (modified from a not-to-be-taken-literally schematic in Houghton et al., 1990). (6) Globally averaged, direct measurements of the combined sea surface temperature and air temperature over the land, shown in this case relative to 1951-80. A stepped warming of about 0.6°C is evident, qualified in the consensus 1990 IPCC Report as 0.3-0.6°C to reflect uncertainties in the data used (from J.T.Houghton et aI., 1990). |
| Data | |
| Źródło |
|
| Autor | Hannes Grobe/AWI |
| Licencja (Ponowne użycie tego pliku) |
Own work, attribution required (Creative Commons CC-BY-3.0) |
| Inne wersje |
Prace pochodne od tego pliku:  |
- Wolno:
- dzielić się – kopiować, rozpowszechniać, odtwarzać i wykonywać utwór
- modyfikować – tworzyć utwory zależne
- Na następujących warunkach:
- uznanie autorstwa – musisz określić autorstwo utworu, podać link do licencji, a także wskazać czy utwór został zmieniony. Możesz to zrobić w każdy rozsądny sposób, o ile nie będzie to sugerować, że licencjodawca popiera Ciebie lub Twoje użycie utworu.
Historia pliku
Kliknij na datę/czas, aby zobaczyć, jak plik wyglądał w tym czasie.
| Data i czas | Miniatura | Wymiary | Użytkownik | Opis | |
|---|---|---|---|---|---|
| aktualny | 01:05, 22 lip 2006 | | 3208 × 2074 (150 KB) | Hgrobe | {{Information| |Description= |Source=own work |Date=2000-04-07 |Author=~~~~ |Permission=Own work, share alike, attribution required (Creative Commons CC-BY-SA-2.5) |other_versions= }} {{self|cc-by-sa-2.5}} Category:Geology, Climate, Ice_Age |
Lokalne wykorzystanie pliku
Poniższa strona korzysta z tego pliku:
Globalne wykorzystanie pliku
Ten plik jest wykorzystywany także w innych projektach wiki:
- Wykorzystanie na bs.wikipedia.org
- Wykorzystanie na da.wikipedia.org
- Wykorzystanie na hr.wikipedia.org
- Wykorzystanie na sh.wikipedia.org
- Wykorzystanie na uk.wikipedia.org