
Plik:Atmosphere gas proportions.svg

Wielkość pliku podglądu PNG dla pliku SVG: 180 × 375 pikseli Inne rozdzielczości: 115 × 240 pikseli | 230 × 480 pikseli | 368 × 768 pikseli | 491 × 1024 pikseli | 983 × 2048 pikseli.
Rozmiar pierwotny (Plik SVG, nominalnie 180 × 375 pikseli, rozmiar pliku: 15 KB)
| Plik Atmosphere gas proportions.svg znajduje się w Wikimedia Commons – repozytorium wolnych zasobów. Dane z jego strony opisu znajdują się poniżej. |
ㅊ됴ㅑ73ㅊㅂㅎ7혀9해ㅑㅎㅊ냏ㅊ됴ㅑ73ㅊ햑.3ㅐ3슈ㅑ. ㅕㅐ34보ㅑㅐ43ㅑㅔㅗ42ㅍ뷰ㅐㅅ3ㅁ픽3ㅎ뱊8헤3ㄱ펴힞ㄷ8ㅔㅕ42류ㅣ924ㅂ히ㅕ8ㅂ3로8ㅣ93ㅂㄱ포ㅔ93ㅅ퓨4
Opis
| Opis |
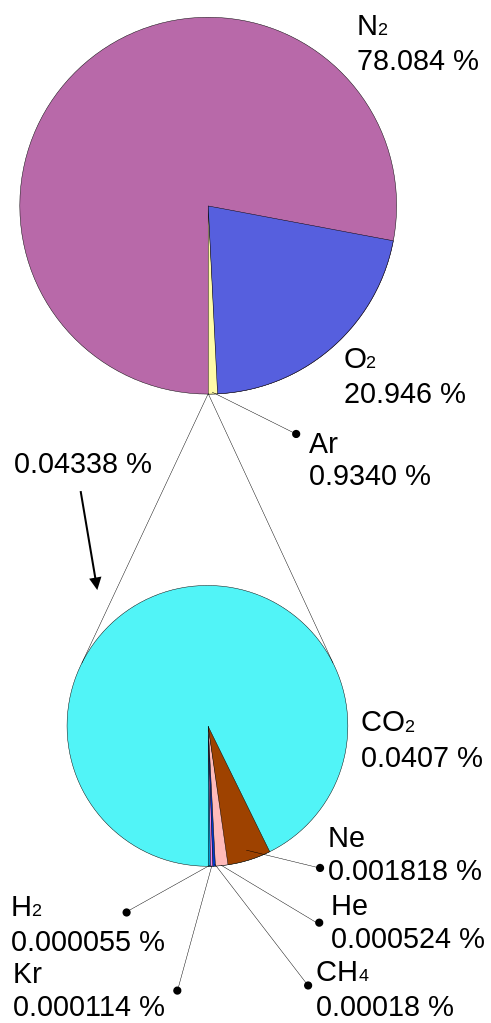
English: Gas proportions in the Earth's atmosphere. The proportion of water vapor (H₂O) is variable so it is not represented in this chart, however it averages about 1% in the troposphere.
Deutsch: Volumenanteil der Gase in der Luft
Magyar: Levegő alkotórészei
Română: Compoziția aerului |
| Data | |
| Źródło | Vectorized version of w:Image:Atmosphere gas proportions.gif (originally by Brockert). I SVG'd it a) to make it more international (chemical symbols) b) to make it (hopefully) clearer when rendered as a thumbnail and c) to make it easier to modify. |
| Autor | Mysid |
| Licencja (Ponowne użycie tego pliku) |
Released into the public domain. |
W3C-validity not checked.
Licencja
| Ja, właściciel praw autorskich do tej pracy, udostępniam ją jako własność publiczną. Dotyczy to całego świata. W niektórych krajach może nie być to prawnie możliwe, jeśli tak, to: Zapewniam każdemu prawo do użycia tej pracy w dowolnym celu, bez żadnych ograniczeń, chyba że te ograniczenia są wymagane przez prawo. |
Historia pliku
Kliknij na datę/czas, aby zobaczyć, jak plik wyglądał w tym czasie.
| Data i czas | Miniatura | Wymiary | Użytkownik | Opis | |
|---|---|---|---|---|---|
| aktualny | 14:48, 31 maj 2022 | | 180 × 375 (15 KB) | Kein Einstein | File uploaded using svgtranslate tool (https://svgtranslate.toolforge.org/). Added translation for de. |
| 10:51, 7 maj 2016 |  | 180 × 375 (11 KB) | Kopiersperre | quick fix, but all values should get recalculated | |
| 11:31, 10 wrz 2014 |  | 180 × 375 (12 KB) | Wereldburger758 | Valid SVG now. | |
| 15:00, 18 cze 2014 |  | 180 × 375 (28 KB) | Kopiersperre | updated to 0,04 % @ CO<sub>2</sub> (after http://co2now.org/) & 0.00018 % @ CH<sub>4</sub> (after http://cdiac.ornl.gov/pns/current_ghg.html, arithmetic mean of northern and southern hemisphere value) | |
| 11:03, 29 lip 2011 |  | 180 × 375 (27 KB) | Spectorman | incorrect data: 0,0387% < 0,037680% on the picture | |
| 06:03, 24 lis 2009 |  | 180 × 375 (27 KB) | Vaughan Pratt | Updates atmospheric CO2 from 350 ppm to 387 ppm and CH4 from 1745 ppb to 1790 ppb (values for 2009, other values were seriously out of date) | |
| 15:48, 28 wrz 2008 |  | 180 × 375 (27 KB) | Xilliah | {{Information |Description= |Source= |Date= |Author= |Permission= |other_versions= }} | |
| 15:36, 30 maj 2006 |  | 320 × 666 (9 KB) | Mysid | vertical-align="sub" didn't work. Using smaller font sizes instead. | |
| 15:31, 30 maj 2006 |  | 320 × 666 (9 KB) | Mysid | {{Information |Description=Gas proportions in the Earth's atmosphere. |Source=Vectorized version of w:Image:Atmosphere gas proportions.gif (originally by Brockert). I SVG'd it a) to make it more internation |
Lokalne wykorzystanie pliku
Następujące strony korzystają z tego pliku:
Globalne wykorzystanie pliku
Ten plik jest wykorzystywany także w innych projektach wiki:
- Wykorzystanie na as.wikipedia.org
- Wykorzystanie na azb.wikipedia.org
- Wykorzystanie na ba.wikipedia.org
- Wykorzystanie na be-tarask.wikipedia.org
- Wykorzystanie na be.wikipedia.org
- Wykorzystanie na bh.wikipedia.org
- Wykorzystanie na br.wikipedia.org
- Wykorzystanie na bs.wikipedia.org
- Wykorzystanie na ca.wikipedia.org
- Wykorzystanie na cs.wikipedia.org
- Wykorzystanie na da.wikipedia.org
- Wykorzystanie na de.wikipedia.org
- Wykorzystanie na de.wikiversity.org
- Wykorzystanie na en.wikipedia.org
- Wykorzystanie na en.wikibooks.org
- Wykorzystanie na en.wikiversity.org
- Wykorzystanie na en.wiktionary.org
- Wykorzystanie na et.wikipedia.org
- Wykorzystanie na eu.wikipedia.org
- Wykorzystanie na frr.wikipedia.org
- Wykorzystanie na ha.wikipedia.org
- Wykorzystanie na hi.wikipedia.org
- Wykorzystanie na hr.wikipedia.org
- Wykorzystanie na hu.wikipedia.org
- Wykorzystanie na ia.wikipedia.org
- Wykorzystanie na it.wikipedia.org
- Wykorzystanie na ja.wikipedia.org
- Wykorzystanie na jv.wikipedia.org
- Wykorzystanie na kk.wikipedia.org
- Wykorzystanie na kn.wikipedia.org
- Wykorzystanie na ko.wikipedia.org
- Wykorzystanie na ku.wikipedia.org
- Wykorzystanie na min.wikipedia.org
- Wykorzystanie na myv.wikipedia.org
Pokaż listę globalnego wykorzystania tego pliku.