
Plik:1982- Deaths from mass shootings in the U.S - scatterplot and line chart.svg

Wielkość pliku podglądu PNG dla pliku SVG: 800 × 600 pikseli Inne rozdzielczości: 320 × 240 pikseli | 640 × 480 pikseli | 1024 × 768 pikseli | 1280 × 960 pikseli | 2560 × 1920 pikseli | 1000 × 750 pikseli.
Rozmiar pierwotny (Plik SVG, nominalnie 1000 × 750 pikseli, rozmiar pliku: 4 KB)
| Plik 1982- Deaths from mass shootings in the U.S - scatterplot and line chart.svg znajduje się w Wikimedia Commons – repozytorium wolnych zasobów. Dane z jego strony opisu znajdują się poniżej. |
Opis
| Opis |
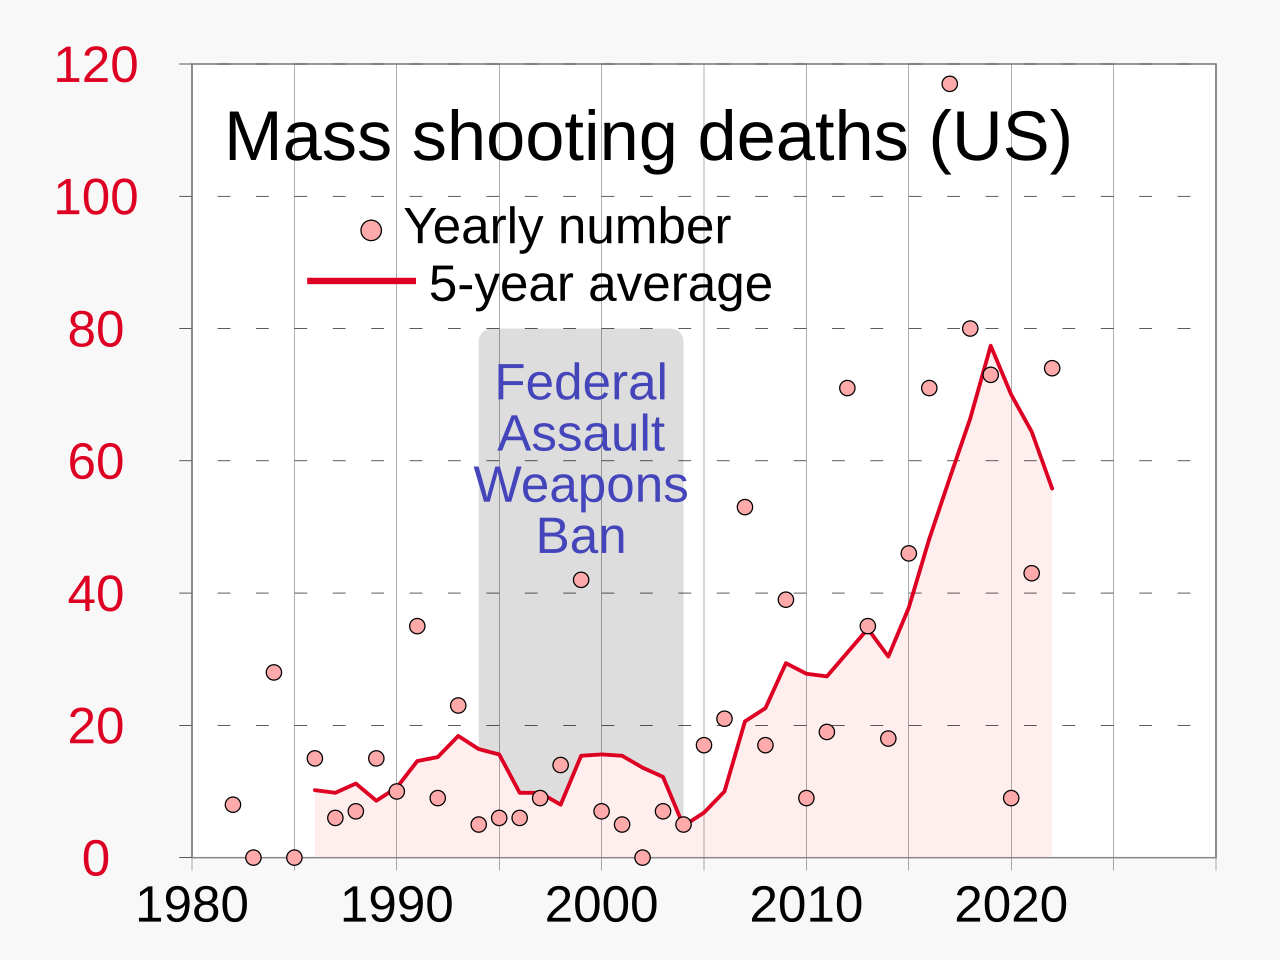
English: Chart showing deaths from mass shootings in the U.S., including 5-year moving average, beginning in 1982
|
||
| Data | |||
| Źródło | Praca własna | ||
| Autor | RCraig09 |

Related files
-
 Predecessor PNG file
 -
 Predecessor JPG file


Licencja
Ja, właściciel praw autorskich do tego dzieła, udostępniam je na poniższej licencji
Ten plik udostępniony jest na licencji Creative Commons Uznanie autorstwa – Na tych samych warunkach 4.0 Międzynarodowe.
- Wolno:
- dzielić się – kopiować, rozpowszechniać, odtwarzać i wykonywać utwór
- modyfikować – tworzyć utwory zależne
- Na następujących warunkach:
- uznanie autorstwa – musisz określić autorstwo utworu, podać link do licencji, a także wskazać czy utwór został zmieniony. Możesz to zrobić w każdy rozsądny sposób, o ile nie będzie to sugerować, że licencjodawca popiera Ciebie lub Twoje użycie utworu.
- na tych samych warunkach – Jeśli zmienia się lub przekształca niniejszy utwór, lub tworzy inny na jego podstawie, można rozpowszechniać powstały w ten sposób nowy utwór tylko na podstawie tej samej lub podobnej licencji.
Historia pliku
Kliknij na datę/czas, aby zobaczyć, jak plik wyglądał w tym czasie.
| Data i czas | Miniatura | Wymiary | Użytkownik | Opis | |
|---|---|---|---|---|---|
| aktualny | 06:47, 4 kwi 2023 | | 1000 × 750 (4 KB) | RCraig09 | Version 3: add to legend |
| 05:46, 2 kwi 2023 |  | 1000 × 750 (4 KB) | RCraig09 | Version 2: reduce thickness of line trace to be less dominant (compatible with related charts) | |
| 23:43, 31 mar 2023 |  | 1000 × 750 (4 KB) | RCraig09 | Uploaded own work with UploadWizard |
Lokalne wykorzystanie pliku
Następujące strony korzystają z tego pliku:
Globalne wykorzystanie pliku
Ten plik jest wykorzystywany także w innych projektach wiki:
- Wykorzystanie na cy.wikipedia.org
- Wykorzystanie na en.wikipedia.org
- Wykorzystanie na en.wikiquote.org
- Wykorzystanie na es.wikipedia.org
- Wykorzystanie na fr.wikipedia.org
- Wykorzystanie na he.wikipedia.org
- Wykorzystanie na id.wikipedia.org
- Wykorzystanie na it.wikipedia.org
- Wykorzystanie na ja.wikipedia.org
- Wykorzystanie na pt.wikipedia.org
- Wykorzystanie na ru.wikipedia.org
- Wykorzystanie na vi.wikipedia.org
- Wykorzystanie na zh.wikipedia.org