
Plik:Milankovitch Variations.png
Milankovitch_Variations.png (479 × 363 pikseli, rozmiar pliku: 32 KB, typ MIME: image/png)
| Plik Milankovitch Variations.png znajduje się w Wikimedia Commons – repozytorium wolnych zasobów. Dane z jego strony opisu znajdują się poniżej. |
Opis
| Opis |
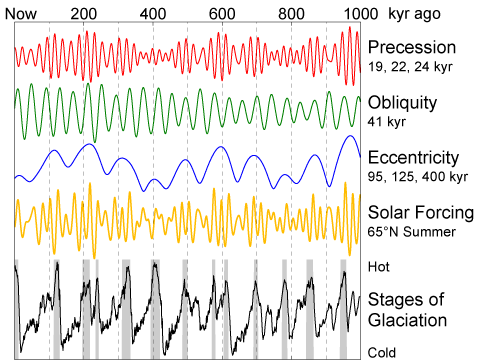
English: This figure shows the variations in Earth's orbit, the resulting changes in solar energy flux at high latitude, and the observed glacial cycles.
According to Milankovitch Theory, the precession of the equinoxes and the apsides, variations in the tilt of the Earth's axis (obliquity) and changes in the eccentricity of the Earth's orbit are responsible for causing the observed 100 kyr cycle in ice ages by varying the amount of sunlight received by the Earth at different times and locations, particularly high northern latitude summer. These changes in the Earth's orbit are the predictable consequence of interactions between the Earth, its moon, and the other planets. The orbital data shown are from Quinn et al. (1991). Principal frequencies for each of the three kinds of variations are labeled. The solar forcing curve (aka "insolation") is derived from July 1st sunlight at 65 °N latitude according to Jonathan Levine's insolation calculator [1]. The glacial data are from Lisiecki and Raymo (2005) and gray bars indicate interglacial periods, defined here as deviations in the 5 kyr average of at least 0.8 standard deviations above the mean. |
| Data | 11 lutego 2006 (data przesłania) |
| Źródło | Praca własna |
| Autor | This image was produced by Robert A. Rohde from publicly available data, and is incorporated into the Global Warming Art project. |
| Inne wersje | Prace pochodne od tego pliku: Variacions de Milankovitch.png |
References
- Lisiecki, L. E., and M. E. Raymo (2005), "A Pliocene-Pleistocene stack of 57 globally distributed benthic δ18O records." Paleoceanography 20, PA1003, doi:10.1029/2004PA001071 (alternative full text link: [2]).
- Quinn, T. R., S. Tremaine, and M. Duncan (1991), "A Three Million Year Integration of the Earth's Orbit." The Astronomical Journal 101, pp. 2287-2305, doi:10.1086/115850.

|
Ta grafika (graph) (lub wszystkie grafiki w tym artykule bądź kategorii) powinny zostać przetworzone na grafiki wektorowe jako plik SVG. O zaletach grafik wektorowych można przeczytać na stronie Commons:Media for cleanup. Jeśli wersja SVG tej grafiki jest już dostępna, załaduj ją. Po załadowaniu SVG zamień ten szablon na stronie tej grafiki na szablon {{vector version available|nazwa nowej grafiki.svg}}.
|
Licencja

|
Udziela się zgody na kopiowanie, rozpowszechnianie oraz modyfikowanie tego dokumentu zgodnie z warunkami GNU Licencji Wolnej Dokumentacji, w wersji 1.2 lub nowszej opublikowanej przez Free Software Foundation; bez niezmiennych sekcji, bez treści umieszczonych na frontowej lub tylnej stronie okładki. Kopia licencji załączona jest w sekcji zatytułowanej GNU Licencja Wolnej Dokumentacji. |
| Ten plik udostępniony jest na licencji Creative Commons Uznanie autorstwa – Na tych samych warunkach 3.0. | ||
| ||
| Ten szablon został dodany jako element zmiany licencjonowania. |
Historia pliku
Kliknij na datę/czas, aby zobaczyć, jak plik wyglądał w tym czasie.
| Data i czas | Miniatura | Wymiary | Użytkownik | Opis | |
|---|---|---|---|---|---|
| aktualny | 13:35, 11 lut 2006 | | 479 × 363 (32 KB) | David Legrand | == Description == This figure shows the variations in Earth's orbit, the resulting changes in solar energy flux at high latitude, and the observed glacial cycles. According to Milankovitch Theory, the precession of the [[ |
Lokalne wykorzystanie pliku
Następujące strony korzystają z tego pliku:
Globalne wykorzystanie pliku
Ten plik jest wykorzystywany także w innych projektach wiki:
- Wykorzystanie na af.wikipedia.org
- Wykorzystanie na ar.wikipedia.org
- Wykorzystanie na be.wikipedia.org
- Wykorzystanie na bg.wikipedia.org
- Wykorzystanie na ca.wikipedia.org
- Wykorzystanie na da.wikipedia.org
- Wykorzystanie na de.wikipedia.org
- Wykorzystanie na de.wikiversity.org
- Wykorzystanie na el.wikipedia.org
- Wykorzystanie na en.wikipedia.org
- Wykorzystanie na es.wikipedia.org
- Wykorzystanie na fa.wikipedia.org
- Wykorzystanie na fi.wikipedia.org
- Wykorzystanie na fr.wikipedia.org
- Wykorzystanie na fy.wikipedia.org
- Wykorzystanie na gl.wikipedia.org
- Wykorzystanie na hu.wikipedia.org
- Wykorzystanie na hy.wikipedia.org
- Wykorzystanie na id.wikipedia.org
- Wykorzystanie na ja.wikipedia.org
- Wykorzystanie na ko.wikipedia.org
- Wykorzystanie na nl.wikipedia.org
Pokaż listę globalnego wykorzystania tego pliku.