
Plik:Logarithmic functions.svg

Wielkość pliku podglądu PNG dla pliku SVG: 600 × 480 pikseli Inne rozdzielczości: 300 × 240 pikseli | 960 × 768 pikseli | 1280 × 1024 pikseli | 2560 × 2048 pikseli.
Rozmiar pierwotny (Plik SVG, nominalnie 600 × 480 pikseli, rozmiar pliku: 27 KB)
| Plik Logarithmic functions.svg znajduje się w Wikimedia Commons – repozytorium wolnych zasobów. Dane z jego strony opisu znajdują się poniżej. |
Opis
| Opis |
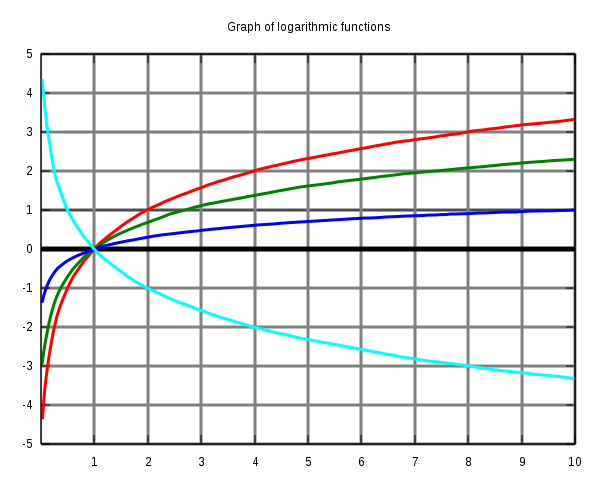
Graph of logarithmic functions in SVG-format. Red is log(x) base 2. Green is ln(x) (log(x) base e). Blue is log(x) base 10. Cyan is log(x) base 0.5.
set terminal svg set output "logarithm.svg" set title "Graph of logarithmic functions" set xrange [0:10] set yrange [-5:5] set xtics 1,1,10 set ytics -5,1,5 set grid linewidth 3 set xzeroaxis linewidth 5 plot log10(x)/log10(2) notitle with lines linewidth 3, log(x) notitle with lines linewidth 3, log10(x) notitle with lines linewidth 3, log10(x)/log10(0.5) notitle with lines linewidth 3 show output |
| Data | |
| Źródło | Praca własna |
| Autor | Christoffer Stausland |
Licencja
Ja, właściciel praw autorskich do tego dzieła, udostępniam je na poniższych licencjach

|
Udziela się zgody na kopiowanie, rozpowszechnianie oraz modyfikowanie tego dokumentu zgodnie z warunkami GNU Licencji Wolnej Dokumentacji, w wersji 1.2 lub nowszej opublikowanej przez Free Software Foundation; bez niezmiennych sekcji, bez treści umieszczonych na frontowej lub tylnej stronie okładki. Kopia licencji załączona jest w sekcji zatytułowanej GNU Licencja Wolnej Dokumentacji. |
| Ten plik udostępniony jest na licencji Creative Commons Uznanie autorstwa – Na tych samych warunkach 3.0. | ||
| ||
| Ten szablon został dodany jako element zmiany licencjonowania. |
Ten plik jest udostępniany na licencji Creative Commons Uznanie autorstwa – na tych samych warunkach 2.5 zlokalizowana, 2.0 zlokalizowana oraz 1.0 zlokalizowana.
- Wolno:
- dzielić się – kopiować, rozpowszechniać, odtwarzać i wykonywać utwór
- modyfikować – tworzyć utwory zależne
- Na następujących warunkach:
- uznanie autorstwa – musisz określić autorstwo utworu, podać link do licencji, a także wskazać czy utwór został zmieniony. Możesz to zrobić w każdy rozsądny sposób, o ile nie będzie to sugerować, że licencjodawca popiera Ciebie lub Twoje użycie utworu.
- na tych samych warunkach – Jeśli zmienia się lub przekształca niniejszy utwór, lub tworzy inny na jego podstawie, można rozpowszechniać powstały w ten sposób nowy utwór tylko na podstawie tej samej lub podobnej licencji.
Możesz wybrać, którą licencję chcesz zastosować.
Historia pliku
Kliknij na datę/czas, aby zobaczyć, jak plik wyglądał w tym czasie.
| Data i czas | Miniatura | Wymiary | Użytkownik | Opis | |
|---|---|---|---|---|---|
| aktualny | 15:22, 11 kwi 2007 | | 600 × 480 (27 KB) | Chrtsta | == Summary == {{Information |Description= Graph of logarithmic functions in SVG-format. Red is log(x) base 1.7. Green is log(x) base 2. Blue is ln(x) (log(x) base e). Cyan is log(x) base 0.5. I made this graph in gnuplot (post-processed using Inkscape) |
| 01:24, 27 mar 2007 |  | 597 × 396 (29 KB) | Dicklyon | Improve it by hand. Use base 10 in place of base 1.7. | |
| 16:32, 17 mar 2007 |  | 600 × 480 (25 KB) | Chrtsta | == Summary == {{Information |Description= Graph of logarithmic functions in SVG-format. Red is log(x) base 1.7. Green is log(x) base 2. Blue is ln(x) (log(x) base e). Cyan is log(x) base 0.5. I made this graph in gnuplot (it is post-processed using Ink | |
| 22:40, 16 mar 2007 |  | 600 × 480 (18 KB) | Chrtsta | Graph of logarithmic functions Red is log(x) base 1.7. Green is log(x) base 2. Blue is ln(x) (log(x) base e). Cyan is log(x) base 0.5. I made this graph in gnuplot, with these instructions: set terminal svg set output "logarithm.svg" set title "Graph o |
Lokalne wykorzystanie pliku
Poniższa strona korzysta z tego pliku:
Globalne wykorzystanie pliku
Ten plik jest wykorzystywany także w innych projektach wiki:
- Wykorzystanie na fi.wiktionary.org
- Wykorzystanie na nn.wikipedia.org
- Wykorzystanie na no.wikipedia.org